Category Archives: Biology

A ‘Canonical’ Cancer-Network Map

cancer_network_poster-v037-op

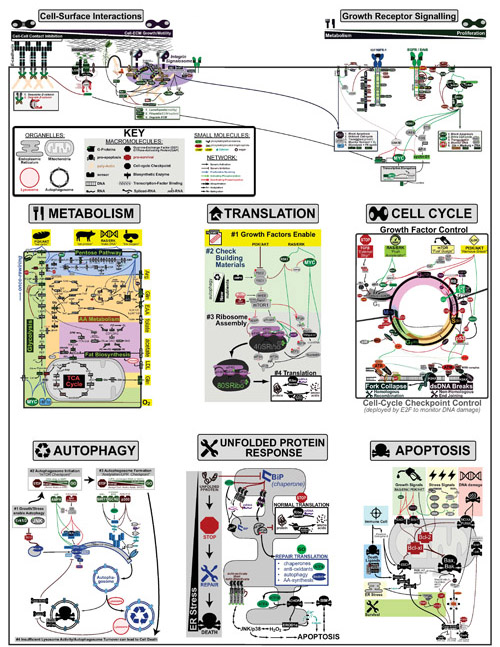
Cancer is a complex disease that is defined by at least 10 different “Hallmarks” that reflect mutation or epigenetically-driven reprogramming of normal cellular circuits. Over the past year, I have compiled a document that attempts to combine what’s known about the intra-cellular network that underlie these “Cancer Hallmarks.” This project started out as a single-page infographic but has since expanded into the 2 foot x 3 foot poster pictured above.

My goal was (and is) to create a comprehensive network map that is conceptually accessible to help me (and now others) think about the “big picture” of cancer networks. Of course, this poster is a work in progress and I will continue to update it over time. Below, I give a brief conceptual description of each module I have used to organize this “Canonical” Cancer-Network Map.

Continue reading

How do you “Fractionate” a Cell?

cell-fractionation-v19

Different scientific questions focus on different parts of the cell and it is often necessary to break a cell up into those different pieces (figure above). While various “-omic” methods are well suited to answering global/systems-level questions for the four catagories listed above (e.g. microscopy, genomics, proteomics, metabolomics) they often lack the resolution of fractionation-methods to answer molecular level questions.

Continue reading

Data-Inference vs Predictive-Modeling

Data Inference vs Predictive Models

Quantitative methods in science can be categorized via their typical place within the scientific method as (1) Inferential which is focused primarily on data analysis and (2) Predictive which is focused on formulating mechanistic hypotheses through modeling. In the figure above we summarize some of the most common methods that fall within each of these categories.

Continue reading

Introduction to Bayesian Inference

Disease Probability from Symptoms

Baysian statistical inference is a very useful method to “back predict” the probability of a hypotheses from data frequency. In the example above, our “hypothesis” is a disease and our “data” is the an associated symptom.” Now, diseases are not measured directly, but rather, are diagnosed based on a combination of symptoms. Bayesian inference allows us to calculate the “Probability of Disease given Symptom 1 (p(D|S1)) with the following information:
Continue reading

DNA Sequencing Methods

Web

While DNA-sequencing methods are diverse and complex they can be grouped into three categories which share several common features: 1. DNA Fragmentation, 2. Fragment Amplification, 3. Sequencing via Fluorescent-Synthesis. These categories are:
Continue reading

PCR Mutagenesis: Overlap Extension

Web

Polymerase Chain-Reaction (PCR) has become the backbone of most Methods in Molecular Biology and site-specific mutagenesis no exception. The key to PCR-based mutation of DNA is careful design of primers. In the simplest case, a point-mutation can be inserted into all PCR products by adding a point mutation to all primers. Unfortunately, for linear DNA, this method only works for mutagenesis at the ends of the template (where the primers bind).

Overlap extension, is a powerful 2-step, multi-PCR technique that can insert mutations at any position and of any size (including whole deletions or insertions). It accomplished this using chimeric primers to (1) cut out pieces of DNA and (2) reassemble them at overlap points:
Continue reading

Kinetics #6: Pulse-Chase Experiments

catalysis-kinetics-intuition-v6

In our sixth post on Understanding Kinetics, we consider pulse-chase experiments which are a common method to study bio-synthetic pathways. In pulse-chase experiments:

  1. A “pulse” of labeled metabolite (P) is added to culture media.
  2. The down-stream intermediates ((P1, P2, P3, etc.)) are measured (“chase“) with mass-spectrometry or radiation.

Continue reading

Kinetics #5: Molecular Complexes (e.g. drug-target)

kinetics-reverse-complex-v01

In our fifth post on Understanding Kinetics, we consider the speed at which molecular complexes form. This is the fundamental mechanism underlying drug action (i.e. drugs inhibition their targets) and cellular signalling (i.e. ligands activate their receptors) and is probably the most important “kinetic effect” to consider in experimental design. Here again we use previously derived mathematical models1 to define some simple rules for the timescales/half-lives and magnitude of these reactions (figure above).

Continue reading

Kinetics #4: Reversible On-Off States

kinetics-reverse-on-off-v02

In our fourth post in the Understanding Kinetics series we consider the speed at which proteins can turn off (A) or on (B). The dynamics of such processes are important to consider when designing experiments (i.e. How long should I wait to take a measurement?) and understanding Network Motifs in signalling cascades. Luckily we can use exact mathematical models (equations below1) for such processes to define some intuitive rules for the timescales/half-lives and magnitude of these reactions (figure above).

Continue reading

Model Organisms and DNA’s “Molecular Clock”

FIG01-evolutions-molecular-clock-v20-op

“Model organisms” are the best-studied organisms in experimental biology. For a particular research questions a specific “model organism” is chosen for its balance of: (1) ease of use and (2) “generalizability” of results. For example

  • unicellular organisms(e.g. bacteria and yeast): are used to answer questions in basic biochemistry or molecular biology;
  • invertebrates (e.g. worms and flys): are used to answer questions in genetics or embryonic development
  • vertebrates (e.g. zebrafish to primates): are used in models of human disease (as they have requisite physiological and neurological complexity)

Continue reading

The Maximal “Rate” of Evolution

pop-mutation-rate-v06

The timescales over which organisms “mutate” or “evolve” varies dramatically from months(viruses) to millions of years(animals). The figure above plots the average genome size in base-pairs (x-axis) versus the average mutation-rate(y-axis) for various organisms. In addition, a second y-axis (“minimum time to 1% mutation”) illustrate approximate timescales corresponding to each rate.

Continue reading

Introduction to RT-PCR (gene/mRNA expression)

rt-pcr-gene-expression-intro-v7

Quantitiative Reverse-Transcriptase PCR (RT-PCR) is different from regular PCR in that it does not measure genes(i.e. DNA) per se but rather measures the EXPRESSION of those gene (i.e. mRNA). Given the fact gene expression (mRNA) can vary dramatically between cell-types, it is important to first isolate a single cell-type by:

Continue reading

Introduction to PCR and Animal Genotyping

pcr-genotyping-intro-v7

In a follow up to our overview on DNA methods, we wanted to discuss PCR (polymerase chain reaction) which is one of the most sensitive and versatile techniques in molecular biology. PCR is a technique which selectively amplifies any targeted DNA from a complex mixture based on a set of framing primers. These primers are ~20 base oligonucleotides which we can (1) design based on a sequenced genome and (2) make/order based on solid-phase chemical synthesis. PCR has many applications (see partial list below) but is to test for a particular gene/mutation (i.e. “genotype”) in an animal (see figure above).

Continue reading

Introduction to the “Family Tree” of DNA Methods

dna-method-overview-v10

Many methods in molecular biology are simply different combinations of a handful of techniques. These combinations can be represented as a “family tree” whose “trunk”/”backbone” is PCR (polymerase chain reaction) and whose “roots”/”foundation” is built upon: (1) chemical synthesis of short oligonucleotides, (2) fully sequenced genomes and (3) vectors derived from bacteria and viruses.

Continue reading

Introduction to Super-resolution Microscopy

microscopy-defraction-limit-v4

While microscopic methods with protein and atom scale resolution – that don’t break the diffraction barrier! – exist (e.g. electron microscopy, atomic force microscopy, x-ray crystallography, etc.), they tend to be more practically difficult than fluorescence-based microscopy (see posts on Fluorescent Probes and Fluorescent Antibodies). Therefore, to give fluorescence microscopy nanometer resolution, several super resolution techniques have been developed that combine clever (1) optical/photophysical and (2) computational-processing tricks to “clean up” the “blurred data.”

Continue reading