
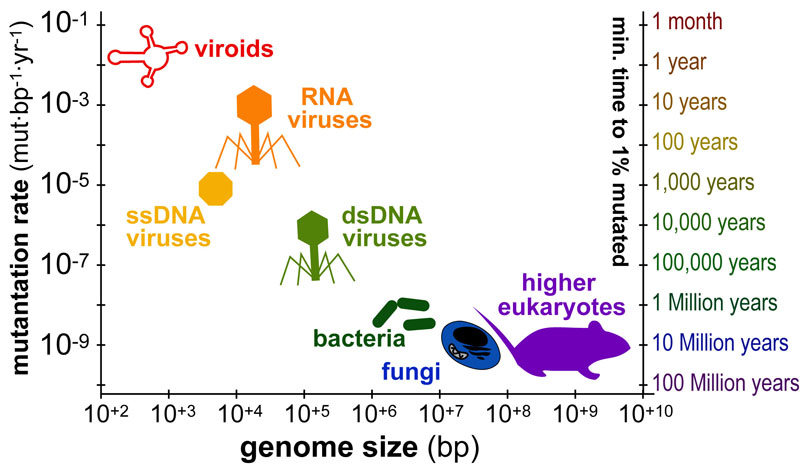
The timescales over which organisms “mutate” or “evolve” varies dramatically from months(viruses) to millions of years(animals). The figure above plots the average genome size in base-pairs (x-axis) versus the average mutation-rate(y-axis) for various organisms. In addition, a second y-axis (“minimum time to 1% mutation”) illustrate approximate timescales corresponding to each rate.
“MUTATIONS” VS “SUBSTITUTIONS”:
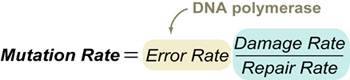
Three main factors determine mutation rate of an organism’s DNA:
- Error rate of DNA polymerase (which copies DNA during cellular division)
- Damage rate of DNA by: hydrolysis, oxidation, photochemical crosslinking, etc.
- Repair rate of DNA-repair enzymes that fix both errors and damage with varying levels of efficiency.
![]()
The “mutation rate” defines genetic changes in individuals while “substitution rate” accounts for genetic changes within a population. These are related as the “mutation rate” sets the maximum “substitution rate” which is only observed in “synonymous/neutral mutations” (where mutations have no affect of the fitness of the organism). Typically, “non-synonymous mutations” occur 10x faster within protein-coding-DNA and 100x slower within ribosomal-RNA-coding-DNA.
SEQUENCE DIVERGENCE OVER TIME:
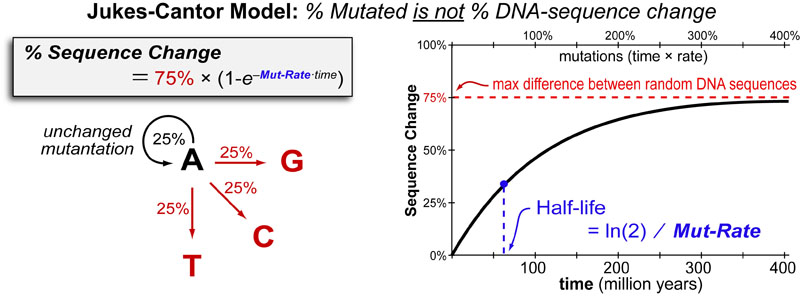
As mutations accumulate over time, not all mutations will result in changes in DNA sequence. This is due to the fact there is a 25% chance a a mutated base (“A” in figure above) will be mutated back to its original base. This sets a ~75% limit on how “different” any two sequences of DNA can ever be. The Jukes-Cantor Model is the simplest model to account for this effect and allows investigators to convert “number of differences in DNA sequence” (which can be directly measured) to “number of mutations in DNA sequence” (which cannot be directly measured). Therefore “differences in DNA sequence” can be converted to “mutations”(Jukes-Cantor Model) that can be converted to “evolutionary time” (scaling factor).
REFERENCES:
- Alberts, B. Molecular Biology of the Cell 5th Ed. Garland Science 2008
- Gago, S.; Elena, S.F.; Flores, R.; Sanjuan, R. Extremely High Mutation Rate of a Hammerhead Viriod. Science 2009 1308.
- Jukes,T.H.; Cantor, C.R. Evolution of Protein Molecules. New York Academic Press. 1969 21–132.
- Kimura, M. Evolutionary Rate at the Molecular Level Nature 1968, 217, 624-626
- Ochman, H.; Wilson, A.C. Evolution in Bacteria: Evidence for a Universal Substitution Rate J. Mol. Evol. 1987, 26, 74-86
- Ayala, F.J. Molecular Clock Mirages BioEssays 1999, 21, 71-75.
- Baldauf, S.L. Phyogeny for the faint of heart TRENDS in Genetics 2003, 19, 345-351.
- Kumar, S. Molecular clocks: four decades of evolution Nat. Rev. Gen. 2005, 6, 654-662.
- Scally, A.; Durbin, R. Revising the human mutation rate: implications for understanding human evolution Nat. Rev. Gen. 2012, 13, 745-753.
- Bier, E., McGinnis,W. Model Organisms in the Study of Development and Disease Inborn Errors of Development: the molecular bassis of clinical disorders of morphogenesis. Oxford University Press 2004
- Hedges, S.B. The Origin and Evolution of Model Organisms Nat. Rev. Gen. 2002, 3, 838-849

This work by Eugene Douglass and Chad Miller is licensed under a Creative Commons Attribution-NonCommercial-ShareAlike 3.0 Unported License.