Author Archives: fingolfn

The Science of Drafting

air-flow-drafting-v1

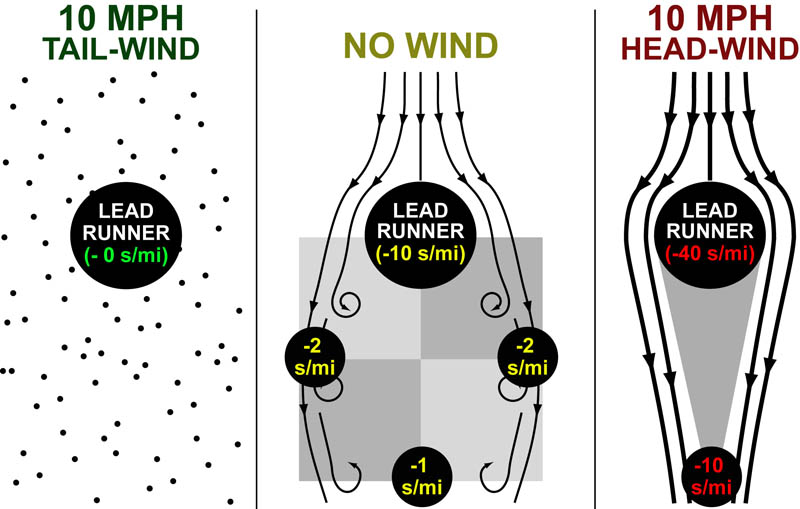
Recently, while running a workout on a windy track, I started wondering about the science of air-resistance and drafting.   More specifically, I wondered what difference was between 10 mph tail-wind and the 10mph head-wind I encountered on opposite sides of the track (see figure above). When I returned home, I discovered some classical papers that answered this exact question in an experimental and theoretical way (summarized in the Figure above).1-4

Continue reading

Choosing a Statistical Test

FIG1_significance-tests-v4

The number and type of possible statistical tests in experimental science can be bewildering. Luckily choosing the right test can be made alot easier by first considering the question: Is your data categorical or continuous? Categorical data is typically percentage or frequency data binned into 2 or more categories or names. Continuous data is typically measurement data where there is a well defined relationship between the values (i.e. numerical data)1,2

Continue reading

Understanding and Comparing Error Bars

statistical-tests-v5

Often, when I look at error bars in figures I am rather confused: “Overlap = bad and no-overlap = good, right?” If this is true, what is the difference between standard deviation bars, standard error bars, and 95% confidence intervals?   Chad recently found a great paper that does a great job answering this question (at least for us).1 Below we try to summarize some of the major points along with a few from other sources.1-3

Continue reading

A “Chemical-Structure Map” of the Metabolome

global-metabolism-v7

I’ve always struggled to connect the structures of natural products with the biosynthetic pathways that generate them. I recently found a great resource in the Kyoto Encyclopedia of Genes and Genomes (KEGG) which helped me address this problem directly. The figure above is an adaptation of several of their pathway charts most especially that pictured here.

Continue reading

The Combinatorial Chemistry of Flavor

Spectroscopy-Microscopy-Spectrum-v4

Taste is only one component of the flavor of food, with others including:

  • texture: gritty vs.  greasy vs. dry
  • aroma:  see post on Food Aroma Chemistry
  • temperature“:  the cooling of mint vs. the heat of chilis

As an aspiring cook, I have found it helpful to summarize the chemistry behind each part of a foods flavor so that I can better understand how to control each of these variables. In the figure above I have summarized the chemical basis for each type of “taste” and food’s that represent characteristic combination.

Continue reading

The “Spectrum” of Microscopic and Spectroscopic Techniques

Spectroscopy-Microscopy-Spectrum-v4

Electromagnetic (EM) radiation is our main source of information about the world (i.e. “seeing is believing”). Most scientific techniques rely on some form of imaging/visualization (“microscopy”) and/or measurement of energy absorption or emission (“spectroscopy”) or both (for instance: fluorescence microscopy). In the figure above we outline the spectrum of electromagnetic radiation from x-rays to microwaves and the different scientific techniques that each type of radiation supports.

Continue reading

A Complete Aerobic Model of Marathon Performance

Print

The equation above is one of the simplest and most accurate predictors of marathon performance (having been shown to account for ~70% of the variability in individual marathon performance).1 In the figures below I delve more deeply into each of these terms to gain a better understanding of the molecular determinants of racing performance.

fig1-VO2max

Continue reading

An Idea for Visualizing Receptor/Ligand X-Ray Structures

Web

As an organic chemist, I have always had difficulty relating the 3D PDB/X-ray structures of receptor/ligand complexes to the 2D chemical drawing chemist build their “chemical insight” off of. In the figure above, I present an idea to bridge the gap by presenting sets of receptor residues as “surfaces” interacting with the two types of 2D representations chemists use to think about chemistry.

Continue reading

What do “PEG-linkers” do to drugs?

06 PEG Linker - ALL MASTER

Where synthetic chemistry has given us many molecules that bind (and inhibit) many different proteins, chemical biology endeavors to “attach” new function to these “classical” drugs. Examples of chemical biological applications include: (1) attaching toxins or imaging agents for targeted deliver or (2) using multivalency to improve a drug’s potency. Unfortunately in order to “attach” new function to a drug you need to use a “linker” which is long and inert so it doesn’t interfer with “binding” or the new “function”. The most common linker material used in chemical biology and pharmacology is polyethylene glycol or PEG (pictured above) which is both long and inert but still impacts the properties of the drugs it is attached to(see figure above):

Continue reading

Understanding Reactivity with Hard-Soft Acid-Base Theory

HSAB-theory-chem-reactivity-v7

Hard-Soft Acid-Base(HSAB) theory one of the most useful rules of thumb for explaining and predicting chemical reactivity trends. Hard molecules tend to be small/non-polarizable and charged while soft molecules tend to be large/polarizable and uncharged. Both acids/electrophiles and bases/nucleophiles can be hard and soft and the defining reactivity rule of HSAB theory is:

Continue reading

Understanding Chemical Structures/Shapes

conformational-analysis-part1-v2

One of the most useful tools in organic chemists’ tool-kit is the ability to visualize molecular structures and use that information to make predictions about a molecule’s shape and reactivity. This process is called conformational analysis and in the figure above we summarize some of the most common rules for drawing out the “shape” (or most stable conformation) of linear and cyclic molecules. In the figure above, the linear “main-chain” is highlighted in red and the cyclic “main-chain” is highlighted in black.

Continue reading

Engineering Molecular Electronics with Substituents

Web

Often, if you are trying to design a molecule which has function (e.g. catalysts, fluorophores, switches, etc.) you have to tweak the electronics of that molecule. Generally, the most important electronic energy levels are the HOMO’s and LUMO’s which can donate and accept electrons, respectively. The figure above summarizes the substituents that are most used to raise the energy (electron donating groups), lower the energy(electron withdrawing groups) or do both (extra conjugation groups).

Continue reading

Understanding Aromaticity based on Molecular Orbital Theory

linear--pi-fmo-energy-v1

Interestingly, once you understand the relative energies of linear pi-molecular orbitals the concept of “aromaticity” becomes alot simpler to understand. For example, cyclizing the frontier molecular orbitals (FMO) of butadiene gives you the anti-aromatic orbitals of cyclobutadiene. The “geometric arrangment” of these aromatic orbitals is a result of alternating stabilization (in green) or destabilization (in red) due to symmetry match or mismatch, respectively.1

Continue reading

The Energies of Linear Frontier Molecular Orbitals

linear--pi-fmo-energy-v1

The Woodward Hoffman rules are some of the most useful rules in organic chemistry. Unfortunately, because these rules are symmetry-based, they mostly ignore the relative energies of the molecular orbitals they consider. Luckily, Huckel theory (on which the Wood-ward Hoffman rules were based) gives as simple, geometric handle on the energies of these orbitals. Understanding these energies is critical for (1) rationalizing non-pericyclic reactivity trends and (2) answering the question: What exactly is aromaticity?

Continue reading

Estimating Metabolite Concentrations at Steady State

Biosynthetic Pathway-Funnel Analogy

In a follow up to our post on sequential biochemical pathways, we next wanted to present an method to approximate the concentration of a metabolic intermediate in a biosynthetic pathway. In general, under steady state conditions, the steady state concentration of a metabolite can be estimated from the ratio of the Vmax for the upstream rate-determining enzyme over the rate of decay of that metabolite. A more complete equation is detailed below and further discussed in our post on Estimating Protein/Metabolite Levels from RNAseq data.

Continue reading