Author Archives: fingolfn

Kinetics #3: Branch Points in Biochemical Pathways

catalysis-kinetics-intuition-v6

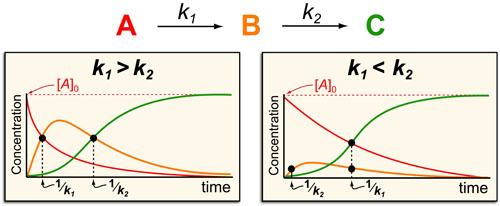
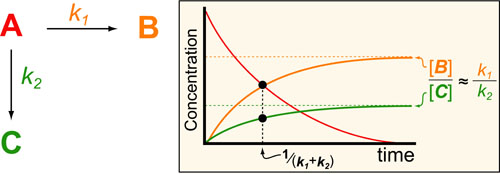
In a follow up to our posts on Intuiting Enzyme Kinetics and Sequential Biochemical Pathways, we next wanted to consider the kinetic curves branch points in biochemical pathways (or equivalently kinetic competitions). Luckily exact mathematical models exist for competitive first-order processes (see below) and we can use these to develop intuitive rules (figure above) if we consider these pathways to be approximately pseudo-first order (which is often true in the context of biosynthetic pathways).

Continue reading

Kinetics #2: Sequential Biochemical Pathways

catalysis-kinetics-intuition-v6

In a follow up to our post our post on intuiting enzyme kinetics, we next wanted to consider the kinetic curves for sequential biochemical pathways. Luckily exact mathematical models exist for sequential first-order processes (see below) and we can use these to develop intuitive rules (figure above) if we consider these pathways to be approximately pseudo-first order (which is often true in the context of biosynthetic pathways).

Continue reading

Kinetics #1: Catalyzed Reaction Timescales

Kinetic-Thermodynamic Models Overview-v1

Most chemical and biochemical research concerns reaction that are catalyzed by either an enzyme or a chemical catalyst. Unfortunately, when we learn chemical kinetics, it is usually in the context of idealized: uncatalyzed 0th-order, 1st-order of 2nd-order chemical reactions. Luckily the intuition we learn from 0 and 1st order processes can be readily extended to catalyzed processes by invoking the pseuso-1st order approximation. Below we describe how to “think about” the most common enzymatic/catalytic kinetic curves you may encounter.

Continue reading

Introduction to Fluorescent Probes

10 Fluorescence Sensitivity

In a follow-up to our introduction to fluorescence, we wanted to discuss why fluorescent probes have proven so useful in chemistry and biology. One of the main reasons is that, unlike most spectroscopic techniques which rely on a loss-of-signal or light-absorption, fluorescence is a “gain of signal” technique. As a result, the near-zero baseline/background translates into a very high signal to noise ratio for fluorescent probes. Indeed fluorescent probes have some of the greatest sensitivities of all sensors (radiation is better but has other draw backs)!

Continue reading

Why are Emission and Excitation Spectra Mirror Images?

 
09 Emission-Excitation Spectra

In a follow-up to our introduction to fluorescence, we wanted to discuss a somewhat confusing(at least for us) detail of fluorescence spectroscopy: the fact that emission spectra and excitation spectra of the same fluorophore are mirror images of each other. It wasn’t until we drew out the diagram pictured above that we truly “got it.”

Continue reading

Introduction to Fluorescence

07 Fluorescence Introduction

Fluorescence (i.e. the emission of light from a electronically excited substance) is one of the most utilized physical phenomena in chemistry and biology. Though humans have been aware of fluorescence for thousands of years (e.g. fireflies), it wasn’t until the discovery of quinine in 1845 that we really started to understand its chemical basis(see figure above). Interestingly, during World War II, the study of quinine’s anti-malarial properties led to the development of the first spectrofluorometers which enabled true quantitative study of fluorescence. Finally, in the 1980-1990’s, new tools in synthetic chemistry and molecular biology allowed rational engineering of chemical fluorophores into a critical class of probes in biophysics(microscopy), molecular biology(sequencing), cell-biology(flow cytometry) and even anatomy (histology)).

Continue reading

Understanding Multivalency (aka Avidity)

Web

Making a Ligand or Drug multivalent is a common method to try to improve the potency or EC50 of that drug from that predicted by the Hill Equation. Below we summarize the full spectrum of multivalent enhancement for the n = 2 case (n being the degree of multivalency) but these rules are easily extendable to the n-valent case aswell.

Continue reading

The Thermodynamic Limits on Small Molecule Drug Affinity

Web

Not too long ago, some really cool papers1,3 sought to examine “The Maximal Affinity of Ligands” by compiling a list of known small-molecule drugs and comparing their affinities (in kcal/mol or Kd‘s see post on the Hill Equation) with various parameters such as molecular weight (see figure above).1

Continue reading

Kinetic Limits on Engineering Agonist Drugs

kinetic-limits-on drug-design-v1

There are many drugs that act as agonists ligands (L) which means they “turn on” their target receptor (RL) so that it induces its normal down-stream signalling. Examples of such drugs include: growth hormones, insulin, steroids and G-protein coupled Recetor(GCPR) ligands such as morphine (opiods), neurotransmitters and scent/aroma compounds. In general you can improve the potency (EC50) of these drugs by improve their binding dissociation constant (Kd) for their receptor (for more detail see post on the Hill Equation).

Continue reading

Binding #3: Competitive Inhibition

Kinetic-Thermodynamic Models Overview-v1

While many drugs act like agonists and “turn on” their target/receptor (see posts on Hill Equation and Agonist Limits), many more drugs act like antagonists and “turn off” their target/receptor. One of the most common mechanisms by which drugs “turn off” a target receptor (R) is by blocking the binding of its natural ligand (L). This mechanism is called competitive inhibition and the antagonist is known as an inhibitor (I). Here there are two dissociation constants:the Kd which describes the strength of the interaction between R and L and the Ki which describes the strength of the interaction between R and I.

Continue reading

Binding #2: The Michaelis-Menton Equation

Kinetic-Thermodynamic Models Overview-v1

The Michaelis-Menton Equation has a very similar form to the Hill Equation but the key difference is that it deals with enzyme rates not ligand/receptor or drug/target interactions per se. Basically, it describes how fast an enzyme (E) makes its product (P) as a function of the total concentration of substrate ([S]t). This rate of production formation (d[P]/dt) is proportional to the kcat and the amount of complex ([ES]) which is exact what the Michaelis-Menton equation models. The Michaelis-constant (Km = (koff+kcat) / kon) describes how tightly the substrate binds the enzyme and the kcat is a rate-constant that describes how quickly the enzyme can make the product. Here,brackets denote concentrations and a t subscript indicates “total concentrations.”

Continue reading

Binding#1: Understanding the Hill Equation

Kinetic-Thermodynamic Models Overview-v1

If you want to understand how drugs work/behave (or just how 2 molecules interact with each other) then you need to understand one of the oldest and most useful theories in biochemistry: the Hill Equation. The Hill Equation mathematically models how Ligands(L)/Drugs interaction with their Receptors(R)/targets and generally assumes that the amount of complex that forms (RL) is proportional to some biological response . Here the Kd represents the “dissociation constant” (which is a measure of the strength of the interaction between R and L) and brackets denote concentrations/dosages (with a t subscript indicating total concentrations).

Continue reading

How High are HOMO’s and Low are LUMO’s?

Print

The energies of a molecule’s Highest Occupied Molecular Orbital’s (HOMO’s) and the Lowest Unoccupied Molecular Orbitals (LUMO’s) tell us alot about that molecules reactivity. In general, molecules with high HOMO’s are good nucleophiles, bases, and reductants while molecules with low LUMO’s are good electrophiles, Lewis acids and oxidants. Unfortunately, the absolute magnitudes of “high” or “low” are very rarely treated. In the figure above, we plotted absolute values of HOMO and LUMO energies to convey more of a global understanding of reactivity trends.

Continue reading

The Color Chemistry of Food

Plant-Chem-2 aromas-v5

Most plant pigments seem to have evolved as “sunscreens” for the photosynthetic machinery of the plant wherein they filter out high energy (potentially damaging) light that cannot be used for photosynthesis. Chemically there are only a few classes of these “sunscreens” whose light absorbing properties lead to rich array of colors that we observe throughout the plant kingdom(see figure above). Below we discuss each class in terms of common observations (e.g. autumn leaves) and cooking considerations.

Continue reading

The Chemistry of Food Aromas

Plant-Chem-2 aromas-v5

All the complex aromas associated with cooking are caused by an ensemble of volatile (small) organic molecules that typically arise from plant material or cooking. As can be seen in the figure above, characteristic aromas arise from small organic molecules with a characteristic functional group: e.g. “fruity” = lactones; “green” = long chain-aldehydes or alcohols; “spicy” = phenols; etc.

Continue reading