
Understanding interactions between processes with different rates can made significantly easier when you know the approximate timescales or half-lives for those processes. Comparing two processes (e.g. alpha helix folding of a peptide chain (micro seconds (10-6s)) and translation of a peptide chain ( milliseconds(10-3s))) if the timescales differ by more than a factor of 100 then you can reasonably assume that as the faster process is occurring, the slower process is standing still (i.e. not occurring). Equivalently you can assume that as the slower process is occuring the faster process occurs instantly. What this means for the example cited above is that the folding of a peptide chain can and does occur before translation of that peptide chain has finished.1-3
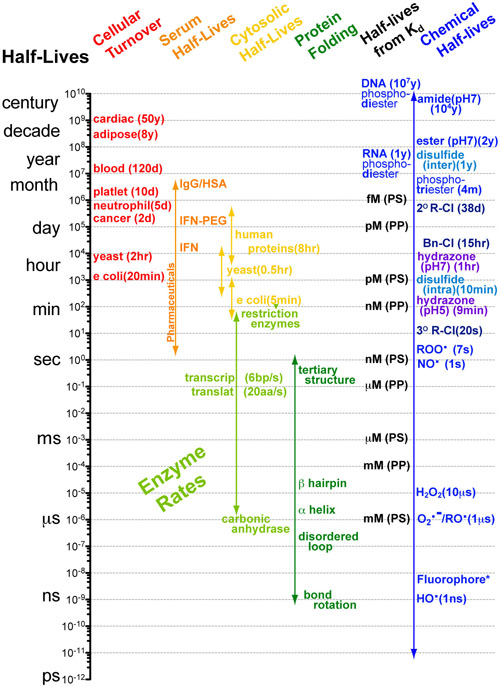
The chart above summarizes the half-lives or approximate time scales of which several different biological processes take place. Each of these timescales are at approximately physiological conditions. In general, at higher temperatures these processes occur faster (×2 per +10°C) and at lower temperatures these processes occur slower (×½ per -10°C ).
Methods Used to Obtain Timescales
Half-Lives can be estimates from unimolecular reactions (i.e. reactions which only have one species) via the inverse of the rate constant (Lim means the “limiting species or concentration.” When the limiting species is gone the reaction stops.):
![]()
![]()
Examples of such processes include protein folding, RNA self-cleavage, disassembly of a receptor/ligand complex or even enzymatic reactions when the enzyme is saturated.
Half-lives can be estimated from bimolecular reactions (i.e. reactions which involve a collision between two species) via the inverse of the rate constant multiplied by the excess concentration (Xs represents the “excess species or concentration.” ):
![]()
![]()
When [Xs] >> [Lim] by a factor of 10 or more this approximation is known as the pseudo-first approximation. Most chemical reactions listed are estimated in the manner where for example the timescales of hydrolysis of an esters, amides/peptides, phosphoroesters, hydrazones, etc. as estimated using water as the excess concentration (for disulfide reduction the excess concentration is glutathione). Rate constants are important for building differential equations which are needed for exact predictions (as opposed to the approximations presented here).
Many Biological processes such as serum half-life and cellular turnover involve many reactions and more complex processes such as flow rates and volumes. As such the values which are listed have been measured experimentally.
Explanation of “BIOLOGICAL PROCESS” Categories
Cellular Turnover: Means the typical cell-cycle time for e coli, yeast and cancer cells. Means the typical time it takes for cells to be replaced in the tissue/blood otherwise.4-11
Serum Half-Lives: How long a protein or drug stays in the blood. These timescales are determined by a combination of enzymatic degredation (proteases, esterases, cytochrome P450, etc.) in the blood/liver and filtration in the kidneys.12-17
- Liver: Molecules which are adsorbed through the gut pass through the liver before entering systematic circulation. As such small molecules with the shortest half-lives are often readily metabolized in the liver. The liver plays the largest role degrading small hydrophobic molecules so that they can get filtered by the kidneys. This occurs in two phases: (1) hydrolysis (esters, amides) and oxidation (aromatics) make hydrophobic molecule more hydrophilic. (2) Conjugation of exposed hydroxyl groups to water soluble molecules makes these molecules even more hydrophilic
- Kidneys: filter anything hydrophilic with a molecular weight <20kD (hydrophobic small molecules can escape filtration by being reabsorbed (through membranes) or by sticking to albumin (molecule weight ~100kD)). This occurs on the order of minutes (typical filtration rate: 130 mL/min typical blood volume: 5 liters)
Reaction rates in the liver for very liver-reactive functional groups such as esters and furans are limited by the blood-flow rate and can occur on the order of minutes. Hydrophobic small molecules with less reactive functional groups can escape both kidney filtration and liver reactions and last in the blood for up to days. Examples are listed in the table below.
Small proteins are usually filtered by the kidneys while larger proteins are degraded upon pinocytosis and degredation in cellular lysosomes. Typical half-lives of proteins in the blood are on the order of hours. Attaching hydrophilic polymers such as polyethylene glycol (PEG) to proteins can make them appear much larger to the kidneys allowing them to escape filtration this has been shown to extend the half-live of interferon (IFN) from 4 hours to 30 hours. IgG and Albumin (HSA) can last in blood for weeks due to their large sizes (150kD and 100kD), the fact the neonatal Fc Receptor rescues them from lysosomal degredation and their compact folds which make them resistant to proteases.
Cytosolic Half-Lives: The range of half-lives of proteins and mRNA in various organisms. For proteins, the half-life of a protein in the cytosol is mostly dictated by the N-terminal amino acid which controls how rapidly the protein is tagged (ubiquitinated) for degredation in the proteosome. Approximate half-lives for proteins with different N-termini are listed in the table below:18-21
| Amino Acid | Mammals | Yeast | E. coli |
| Val | 100hr | >20hr | >10hr |
| Met | 30hr | >20hr | >10hr |
| Gly | 30hr | >20hr | >10hr |
| Pro | >20hr | >20hr | ? |
| Ala | 4.4hr | >20hr | >10hr |
| Ser | 1.9hr | >20hr | >10hr |
| Thr | 7.2hr | >20hr | >10hr |
| Cys | 1.2hr | >20hr | >10hr |
| Ile | 20hr | 30min | >10hr |
| Glu | 1hr | 30min | >10hr |
| His | 3.5hr | 10min | >10hr |
| Tyr | 2.8hr | 10min | 2min |
| Gln | 0.8hr | 10min | >10hr |
| Asp | 1.1hr | 3min | >10hr |
| Asn | 1.4hr | 3min | >10hr |
| Phe | 1.1hr | 3min | 2min |
| Leu | 5.5hr | 3min | 2min |
| Trp | 2.8hr | 3min | 2min |
| Lys | 1.3hr | 3min | 2min |
| Arg | 1.0hr | 2min | 2min |
Enzymatic Rates: These timescales listed assume that the active site of the enzyme is saturated. If the active site is not saturated these timescale must be multiplied by the concentration of substrate to obtain the time-scale of reaction. As such, what these values actually mean is: the speed at which a enzyme can perform its reaction once the substrate is bound (which can be delayed if the enzyme can’t find its substrate)3,22-26
Protein Folding: Timescales for protein folding are determined by a combination of the energetic barriers for rotation of bonds into the proper conformation and the number of conformations which must be searched to find a local minimum (i.e. stable secondary or tertiary structure)1,2,27
Half-lives from Kd’s: Dissociation constants or Kd’s tell you the relative affinity of a ligand for its receptor (and often the potency or EC50). Physically Kd’s represent the ratio of rate constants for the forward (binding) and reverse (dissociation) reactions:28,29
![]()
Because the forward rate constants for protein-small molecule (PS) and protein-protein (PP) complexes don’t vary much (being determined by collision frequency instead of characteristics of the complex itself) we can use those values to estimate how long a ligand/drug will stay bound to its receptor/target protein:
![]()
![]()
Chemical Half-Lives: estimated from rate constants as outlined above or experimentally determined.30-34
REFERENCES:
1. Protein Folding: Review. Curr Op Struct Biol. 2004;14:76.
2. Protein Folding: alpha-helix. PNAS. 1999;96:7232.
3. Enzyme Rates: Translation in general. Biochem J 160:185.
4. Cellular Turnover: Yeast. Nature. 2007;448:947.
5. Cellular Turnover: Red Blood Cells. J Biol Chem 1946;166:627.
6. Cellular Turnover: Platlets. Am J Hematol. 1989;30:206.
7. Cellular Turnover: neutrophils. J Immunol. 2008;181:5183.
8. Cellular Turnover: e coli. Gut. 1976;17:219.
9. Cellular Turnover: Cardiac cell. Science. 2009;324:98.
10. Cellular Turnover: Cancer Cell Lines. The Prostate. 2000;44:164.
11. Cellular Turnover: Adipose Cells. Nature. 2008;453:783.
12. Serum Half-life: Norepinephrin. Br J Anaesth. 2005;95:782.
13. Serum Half-life: min to hrs for proteins/peptides. Amino Acids. 2006;30:351.
14. Serum Half-life: IFN/PEG-IFN. Clin Pharm Ther. 2000;68:556.
15. Serum Half-life: Dutasteride. Urology. 2009;73:37.
16. Serum Half-Life: Albumin/IgG. Curr Op Biotech. 2011;22:868.
17. Brenner GM, Stevens CW. Parmacology: Saunders; 2012.
18. Cytosolic Half-lives: Proteins. PNAS. 2006;103:13004.
19. Cytosolic Half-lives: N-end Rule. J Biol Chem. 1981;264:16700.
20. Cytosolic Half-lives: N-end Rule. Genes to Cells. 1997;1:13.
21. Cytosolic Half-lives: mRNA. Genome Res 2003;13:1863.
22. Enzyme Rates: Restriction Enzymes. J Biol Chem. 1976;251:5866.
23. Enzyme Rates: mammal transcription. Nat Struct Mol Biol. 2007;14:796.
24. Enzyme Rates: e coli transcription. J Mol Biol. 1968;38:163.
25. Enzyme Rates: e coli transcription. J Bacteriol. 1994;176:2807.
26. Enzyme Rates: Nucl Acids Res 2010;38:0750.
27. Protein Folding: Tertiary Structure. Nat Struct Mol Biol. 1998;5:385.
28. Timescales from Kd’s: Protein-Small Molecule. J Phys Chem. 1958;62:154.
29. Timescales from Kd’s: Protein-Protein. PNAS. 1992;89:3338.
30. Chemical Half-lives: ROS. Eur J Biochem. 1993;215:213.
31. Chemical Half-lives: ROS. Nat Rev Mol Cell Biol. 2007;8:722.
32. Chemical Half-lives: RNA. RNA. 2003;9:907.
33. Chemical Half-lives: Phosphodiesters and triesters. PNAS. 2006;103:4052.
34. Larson RA, Weber EJ. Reaction Mechanisms in Environmental Chemistry: CRC Press; 1994.

This work by Eugene Douglass and Chad Miller is licensed under a Creative Commons Attribution-NonCommercial-ShareAlike 3.0 Unported License.