
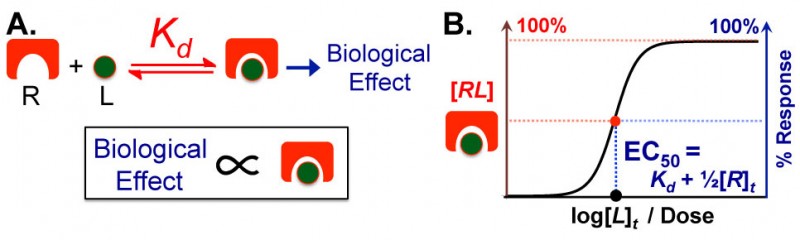
A. Most Ligand (L)/Receptor (R) dose response curves are characterized by complex formation followed by biological effect. The underlying assumption here is that biological effect is proportional to the amount of complex which forms. B. Assuming the biological effect and amount of complex are proportional, dose-response curves can be envisioned too equivalent axes: amount complex (in red) and percentage biological response (in blue). The key to intuitively understanding these curves is to understand the Effective Concentration 50% or EC50 which tells you the dose of ligand necessary to elicit a 50% response. The EC50 is also known as the ligands potency.