Author Archives: fingolfn

Timescales, Kinetics, Rates, Half-lives in Biology

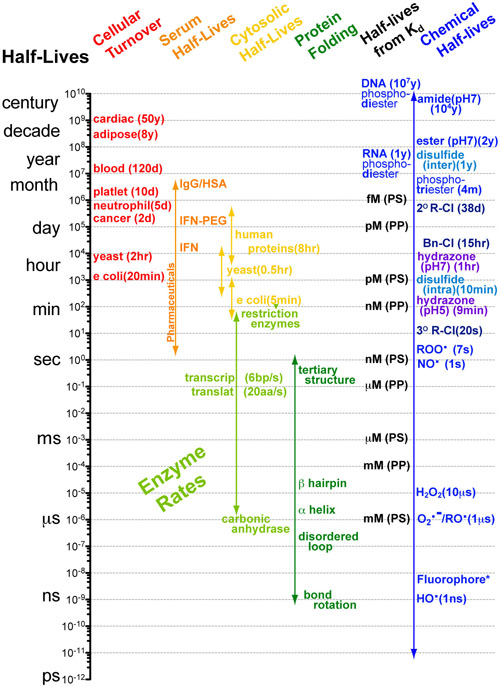
Understanding interactions between processes with different rates can made significantly easier when you know the approximate timescales or half-lives for those processes.   Comparing two processes (e.g. alpha helix folding of a peptide chain (micro seconds (10-6s)) and translation of a peptide chain ( milliseconds(10-3s))) if the timescales differ by more than a factor of 100 then you can reasonably assume that as the faster process is occurring, the slower process is standing still (i.e. not occurring). Equivalently you can assume that as the slower process is occuring the faster process occurs instantly. What this means for the example cited above is that the folding of a peptide chain can and does occur before translation of that peptide chain has finished.1-3

Continue reading

How do Experimentalists use Mathematical Models?

Figure 1.  Mathematical models act as a bridge between the conditions of an experimental system and its behavior (the data). When a portion of either is unknown you can combine the knowns (black arrows) and calculate the unknowns (red arrows) using simple software packages such as Excel or Prism.

Mathematical models are equations (or systems of equations) that allow one the connect the conditions of a system/experiment with its predicted behavior/experimental data. Figure 1 shows an example of this where the Langmuir-Hill equation (in the center) connects the conditions (left) of a fluorescence binding assay with the dose-response curve (right) that results from conducting the experiment.

Continue reading

Understanding Ligand-Receptor Dose Response Curves

Figure 1 A.
Most Ligand (L)–Receptor (R) dose–response curves are characterized by formation of a complex followed by biological effect. The underlying assumption is that biological effect is proportional to the amount of complex that forms. B. Assuming the biological effect and amount of complex formed are proportional, dose–response curves can be envisioned on two equivalent axes: amount complex (in red) and percentage biological response (in blue). The key to intuitively understanding these curves is to understand the Effective Concentration 50% or EC50 which tells you the dose of ligand necessary to elicit a 50% response. The EC50 is also known as the ligand’s potency.

Biological phenomena are often caused by the binding of a ligand (L (e.g. drug, hormone, etc.)) to a target receptor (R), which induces a biological response (Figure 1A). Typically, the biological response is proportional to the amount of ligand-receptor complex (RL) that forms (Figure 1A); as a result, the dose–response curve can have two equivalent y-axes: amount of complex (in red) or biological response (in blue). These curves have a sigmoidal (S-like) shape, where low doses of ligand have no effect and high doses plateau at maximal (100%) complex formation/biological response (Figure 1B).

Continue reading

Intuiting Biological Scales using Human Scales

Figure 1. Human Scale Key: Aircraft Carrier (200m), 3-story House (20m), Human (2m), Liver/Gerbil (200mm), Lymph Node/Mosquito (20mm), Skin/Flee (2mm), Hair thickness (200um)
Biological Scale Key: Flee (2mm), Amoeba (200um), Eukaryotic Cell (20um), Mitochondria/Bacteria (2um), Centriol/Large Virus (200nm), Cell Membrane/Small Virus (20nm), dsDNA thickness (2nm)

The length scale of molecular and cellular biology (Figure 1 Biological Scales) covers approximately 5 orders of magnitude, with sizes ranging from 1 nanometer (approximate size of small molecules) to 100 micrometers (approximate size of the largest cells). Unfortunately, it can be difficult to intuit these relative sizes because we cannot directly observe these scales.

Continue reading

A Single pKa Chart: Visualizing Reactivity Trends

Figure 1 A. Chemical Functional Groups organized by pKa (y-axis) and acidic atom (x-axis: oxygen, nitrogen, carbon, other.)  B. Key for using A given a solution pH. First, mark the position of the solution pH on the pKa axis (dotted horizontal line). all functional groups above it are neutral or positively charged while all functional groups below it are negative or neutral. Second, the pKa axis is useful in further categorizing functional groups by their ability to participate in hydrogen bonds.

The pKa value of a chemical functional group (Figure 1A) is very useful because it can directly give you the approximate charged state of that functional group (in the context of drugs, proteins, membranes, DNA, etc.) at a specific solution pH.  As such, the pKa is critical to an intuitive understanding of electrostatics in chemical and biological contexts.

Continue reading