
Often, when I look at error bars in figures I am rather confused: “Overlap = bad and no-overlap = good, right?” If this is true, what is the difference between standard deviation bars, standard error bars, and 95% confidence intervals? Chad recently found a great paper that does a great job answering this question (at least for us).1 Below we try to summarize some of the major points along with a few from other sources.1-3
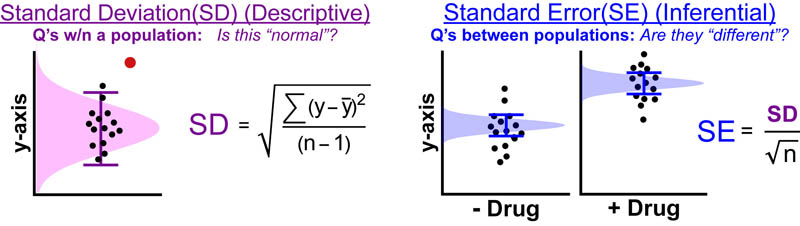
STANDARD DEVIATION (What is the “normal” spread?)
Let’s start with standard deviation (SD). SD models a set of data points as if it were a normal distribution where the mean (y) ± SD captures 68.4% of the data; y ± 2SD captures 95% of the data; and y ± 3SD captures 99.7% of the data.1,3
SD, is what’s known as a “descriptive statistic” which means it can be used to answer questions within the specific population that it models (see figure above). Because, SD estimates a whole population it doesn’t change much as the number of data points (n) increases. SIDE NOTE: If you’re curious why n-1 is used in the SD equation instead of n you can find a great explanation here.2
STANDARD ERROR (Is there a difference?)
Standard error (SE), on the other hand, gives information on the mean/average of a set of data points NOT the distribution of a population. In other words, SE tells you the likely error in your estimation of y while SD tells you the likely spread of all you data points around y.
SE, is what’s known as an “inferential statistic“ which means it can be used to answer questions between different data-sets; such as, are these two data-sets different? Because most experimental science compares one experimental condition (the “test”) to another (the “reference” / “baseline” / “negative control” / “null”) SE bars are typically the error bars of choice. SE models the “uncertainty of the mean” as if it were a normal distribution where the y±SD has a 68.4% probability of capturing the “true mean”; y ± 2SD has a 95% probability of capturing the “true mean”; and y±3SD has a 99.7% probability of capturing the “true mean”. Because, SD models the uncertainty in the mean it decreases as the number of data points (n) increases.
Confidence Intervals and P-values don’t use normal distributions
95% confidence intervals (CI) and p-values are also inferential statistics but do not model a set of data points as a normal distribution. Experimentally, while many data points (n > 9) “look” normally distributed fewer data points (n < 9) "look" like more "flattened" in their distribution. CI's and p-values capture some of this variation (which SE misses) by modeling a set of data points as something like a “t-distribution“ which has a flatter shape as n→0 and a more normal shape as n→∞. As a result, when n = 3 (t-distribution ≠ normal distribution) CI are approximately 4×SE; when n > 9 (t-distribution ≈ normal distribution) CI are approximately 2×SE (see figure below).1,3
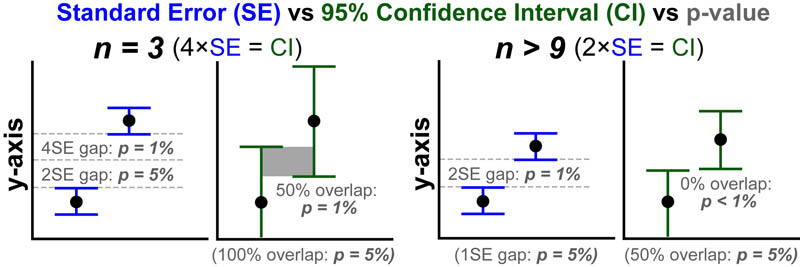
P-VALUE (Is there a difference?)
The p-value, estimates the “statistically significance” in the difference between the means of the”test” and “reference”/”baseline”/”negative control” conditions. The lower the p-value the more likely a difference exists. Typically p < 5% are considered “significant” while p-values < 1% are considered “highly significant.” The figure above summarizes some basic heuristics to extract approximate p-value different error bars and n-values. Keep in mind that when p > 5% you cannot conclude that “no difference exists”. Instead, you can only conclude that your current data cannot conclusively measure any difference.1,3
CONFIDENCE INTERVAL (Is the magnitude of the difference meaningful?)
While a p-value asks: “Does a difference exist? a confidence interval (CI) also asks: “is the effect size meaningful?” In situations where you have a p-value <1% but there is significant overlap between the CI one must consider that a statistically significant difference might not be functionally relevant (because this “real” difference is of similar magnitude to sample-to-sample variation). For example, if a drug works 51% of the time that might very well be statistically significant but it is unlikely any pharaceutical company will try to bring it to market.1,3
REFERENCES:
- Cumming, G.; Fidler, F.; Vaux, D.L. Error Bars in experimental biology. The Journal of Cell Biology 2007, 177, 7-11.
- Book, S.A.Why n-1 in the Formula for the Sample Standard Deviation? The Two-Year College Mathematics Journal. 1979, 10, 330.
- McDonald, J.H. 2014. Handbook of Biological Statistics, 3rd ed. Sparky House Publishing, Baltimore, Maryland.

This work by Eugene Douglass and Chad Miller is licensed under a Creative Commons Attribution-NonCommercial-ShareAlike 3.0 Unported License.