Category Archives: Physical Chemistry

What is Entropy??

 
Web

Entropy (S) can be best understood as “the effect of probability on a physical or chemical processes”. This relationship is famously described by the Boltzmann entropy formula which relates the probability of a particular state (P1) to the chemical or mechanical work (ΔG) required to obtain that state.
Entropy changes(ΔS), are not probabilities per se but rather a conceptual bridge between probability and energy. In this equation, k is the Boltzmann constant, T is temperature, P is the probability of the considered state, ΔS is the entropy change and ΔG is the free energy change.

Continue reading

Why are Emission and Excitation Spectra Mirror Images?

 
09 Emission-Excitation Spectra

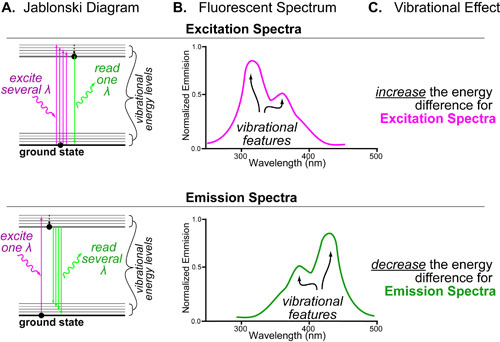
In a follow-up to our introduction to fluorescence, we wanted to discuss a somewhat confusing(at least for us) detail of fluorescence spectroscopy: the fact that emission spectra and excitation spectra of the same fluorophore are mirror images of each other. It wasn’t until we drew out the diagram pictured above that we truly “got it.”

Continue reading

Introduction to Fluorescence

07 Fluorescence Introduction

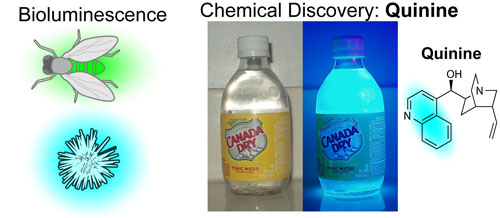
Fluorescence (i.e. the emission of light from a electronically excited substance) is one of the most utilized physical phenomena in chemistry and biology. Though humans have been aware of fluorescence for thousands of years (e.g. fireflies), it wasn’t until the discovery of quinine in 1845 that we really started to understand its chemical basis(see figure above). Interestingly, during World War II, the study of quinine’s anti-malarial properties led to the development of the first spectrofluorometers which enabled true quantitative study of fluorescence. Finally, in the 1980-1990’s, new tools in synthetic chemistry and molecular biology allowed rational engineering of chemical fluorophores into a critical class of probes in biophysics(microscopy), molecular biology(sequencing), cell-biology(flow cytometry) and even anatomy (histology)).

Continue reading

The Thermodynamic Limits on Small Molecule Drug Affinity

Web

Not too long ago, some really cool papers1,3 sought to examine “The Maximal Affinity of Ligands” by compiling a list of known small-molecule drugs and comparing their affinities (in kcal/mol or Kd‘s see post on the Hill Equation) with various parameters such as molecular weight (see figure above).1

Continue reading

A Single pKa Chart: Visualizing Reactivity Trends

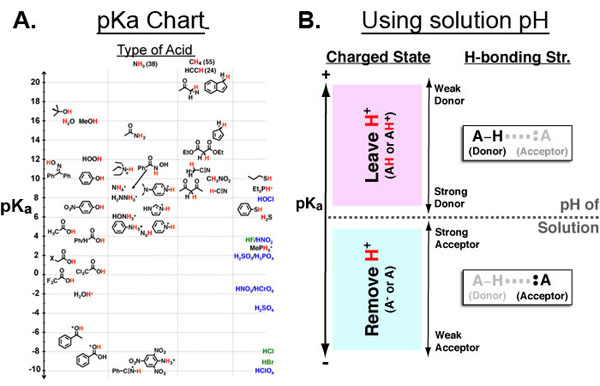
Figure 1 A. Chemical Functional Groups organized by pKa (y-axis) and acidic atom (x-axis: oxygen, nitrogen, carbon, other.)  B. Key for using A given a solution pH. First, mark the position of the solution pH on the pKa axis (dotted horizontal line). all functional groups above it are neutral or positively charged while all functional groups below it are negative or neutral. Second, the pKa axis is useful in further categorizing functional groups by their ability to participate in hydrogen bonds.

The pKa value of a chemical functional group (Figure 1A) is very useful because it can directly give you the approximate charged state of that functional group (in the context of drugs, proteins, membranes, DNA, etc.) at a specific solution pH.  As such, the pKa is critical to an intuitive understanding of electrostatics in chemical and biological contexts.

Continue reading