Category Archives: Chemistry

The Chemistry of Wine Flavor

WINE_Summary-v14-op

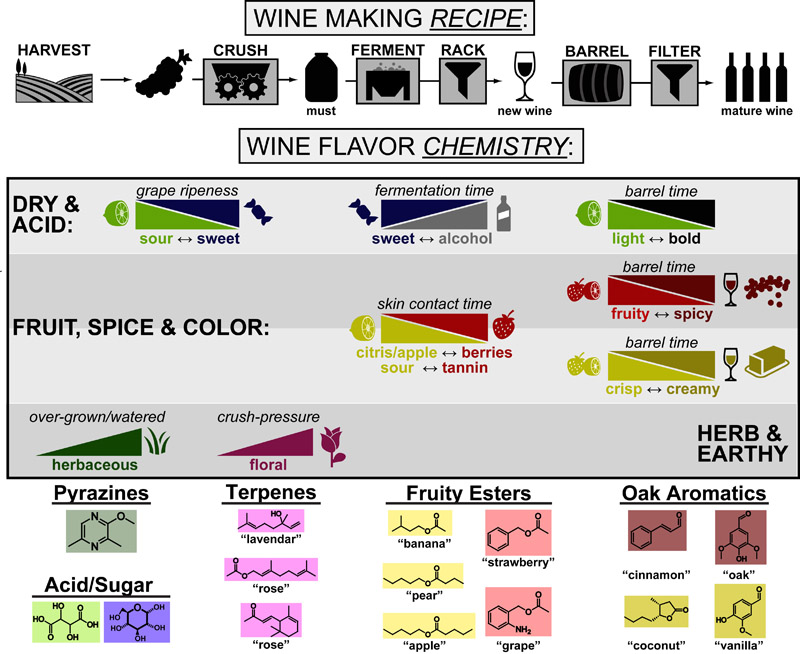
Our recent whiskey-graphic, led to some requests for a similar graphic on wine. Based on our research, wine appears to have a simpler “process chemistry” but more complicated “flavor chemistry” than whiskey. While we are still anchoring this graphic in the “production process chemistry” its major focus is on how individual steps affect the flavor of a wine.

Continue reading

The Chemistry of Whiskey Production

WHISKEY_Summary-v07

A recent trip along the Bourbon Trail of Kentucky inspired the above summary (which started as rough notes from tours of four distilleries) which compares: (1) Whiskey Production Recipe (2) Whiskey Production Chemistry and (3) Distinguishing characteristics of major whiskey types. More detailed information can be found in the references below.

Continue reading

What is Entropy??

 
Web

Entropy (S) can be best understood as “the effect of probability on a physical or chemical processes”. This relationship is famously described by the Boltzmann entropy formula which relates the probability of a particular state (P1) to the chemical or mechanical work (ΔG) required to obtain that state.
Entropy changes(ΔS), are not probabilities per se but rather a conceptual bridge between probability and energy. In this equation, k is the Boltzmann constant, T is temperature, P is the probability of the considered state, ΔS is the entropy change and ΔG is the free energy change.

Continue reading

The “Spectrum” of Substitution vs. Elimination

spectrum-sn1-e1-sn2-e2-v2

Substitution and elimination reactions (between Lewis-bases and alkyl-halides) are some of the first reactions taught in organic chemistry. The figure above, organizes the main factors that distinquish: SN1, SN2, E1 or E2 mechanisms into a single, 4-quadrant spectrum. We describe the heirarchy of these factors in more detail below.

Continue reading

ELISA-based High Throughput Screening

 
17 APPROXIMATE MODEL -ELISA

In a follow-up to our post introducing ELISA, we wanted to discuss a common application of this technique: small molecule inhibitor screening. The set up is relatively simple (1) Coat a 96-well plate with your two proteins of interest and and a detector antibody (2) add a library of 96 molecules per plate (3) Inspect which molecules inhibit the protein-protein interaction (resulting in a color loss).

Once you have have narrowed down your library to a list of inhibitors, you can rank those inhibitors by their potency/IC50 by running dilution series with the exact same plate set-up:

Continue reading

A “Chemical-Structure Map” of the Metabolome

global-metabolism-v7

I’ve always struggled to connect the structures of natural products with the biosynthetic pathways that generate them. I recently found a great resource in the Kyoto Encyclopedia of Genes and Genomes (KEGG) which helped me address this problem directly. The figure above is an adaptation of several of their pathway charts most especially that pictured here.

Continue reading

What do “PEG-linkers” do to drugs?

06 PEG Linker - ALL MASTER

Where synthetic chemistry has given us many molecules that bind (and inhibit) many different proteins, chemical biology endeavors to “attach” new function to these “classical” drugs. Examples of chemical biological applications include: (1) attaching toxins or imaging agents for targeted deliver or (2) using multivalency to improve a drug’s potency. Unfortunately in order to “attach” new function to a drug you need to use a “linker” which is long and inert so it doesn’t interfer with “binding” or the new “function”. The most common linker material used in chemical biology and pharmacology is polyethylene glycol or PEG (pictured above) which is both long and inert but still impacts the properties of the drugs it is attached to(see figure above):

Continue reading

Understanding Reactivity with Hard-Soft Acid-Base Theory

HSAB-theory-chem-reactivity-v7

Hard-Soft Acid-Base(HSAB) theory one of the most useful rules of thumb for explaining and predicting chemical reactivity trends. Hard molecules tend to be small/non-polarizable and charged while soft molecules tend to be large/polarizable and uncharged. Both acids/electrophiles and bases/nucleophiles can be hard and soft and the defining reactivity rule of HSAB theory is:

Continue reading

Understanding Chemical Structures/Shapes

conformational-analysis-part1-v2

One of the most useful tools in organic chemists’ tool-kit is the ability to visualize molecular structures and use that information to make predictions about a molecule’s shape and reactivity. This process is called conformational analysis and in the figure above we summarize some of the most common rules for drawing out the “shape” (or most stable conformation) of linear and cyclic molecules. In the figure above, the linear “main-chain” is highlighted in red and the cyclic “main-chain” is highlighted in black.

Continue reading

Engineering Molecular Electronics with Substituents

Web

Often, if you are trying to design a molecule which has function (e.g. catalysts, fluorophores, switches, etc.) you have to tweak the electronics of that molecule. Generally, the most important electronic energy levels are the HOMO’s and LUMO’s which can donate and accept electrons, respectively. The figure above summarizes the substituents that are most used to raise the energy (electron donating groups), lower the energy(electron withdrawing groups) or do both (extra conjugation groups).

Continue reading

Understanding Aromaticity based on Molecular Orbital Theory

linear--pi-fmo-energy-v1

Interestingly, once you understand the relative energies of linear pi-molecular orbitals the concept of “aromaticity” becomes alot simpler to understand. For example, cyclizing the frontier molecular orbitals (FMO) of butadiene gives you the anti-aromatic orbitals of cyclobutadiene. The “geometric arrangment” of these aromatic orbitals is a result of alternating stabilization (in green) or destabilization (in red) due to symmetry match or mismatch, respectively.1

Continue reading

The Energies of Linear Frontier Molecular Orbitals

linear--pi-fmo-energy-v1

The Woodward Hoffman rules are some of the most useful rules in organic chemistry. Unfortunately, because these rules are symmetry-based, they mostly ignore the relative energies of the molecular orbitals they consider. Luckily, Huckel theory (on which the Wood-ward Hoffman rules were based) gives as simple, geometric handle on the energies of these orbitals. Understanding these energies is critical for (1) rationalizing non-pericyclic reactivity trends and (2) answering the question: What exactly is aromaticity?

Continue reading

Kinetics #1: Catalyzed Reaction Timescales

Kinetic-Thermodynamic Models Overview-v1

Most chemical and biochemical research concerns reaction that are catalyzed by either an enzyme or a chemical catalyst. Unfortunately, when we learn chemical kinetics, it is usually in the context of idealized: uncatalyzed 0th-order, 1st-order of 2nd-order chemical reactions. Luckily the intuition we learn from 0 and 1st order processes can be readily extended to catalyzed processes by invoking the pseuso-1st order approximation. Below we describe how to “think about” the most common enzymatic/catalytic kinetic curves you may encounter.

Continue reading

Introduction to Fluorescent Probes

10 Fluorescence Sensitivity

In a follow-up to our introduction to fluorescence, we wanted to discuss why fluorescent probes have proven so useful in chemistry and biology. One of the main reasons is that, unlike most spectroscopic techniques which rely on a loss-of-signal or light-absorption, fluorescence is a “gain of signal” technique. As a result, the near-zero baseline/background translates into a very high signal to noise ratio for fluorescent probes. Indeed fluorescent probes have some of the greatest sensitivities of all sensors (radiation is better but has other draw backs)!

Continue reading

Why are Emission and Excitation Spectra Mirror Images?

 
09 Emission-Excitation Spectra

In a follow-up to our introduction to fluorescence, we wanted to discuss a somewhat confusing(at least for us) detail of fluorescence spectroscopy: the fact that emission spectra and excitation spectra of the same fluorophore are mirror images of each other. It wasn’t until we drew out the diagram pictured above that we truly “got it.”

Continue reading