Category Archives: Systems Biology

A ‘Canonical’ Cancer-Network Map

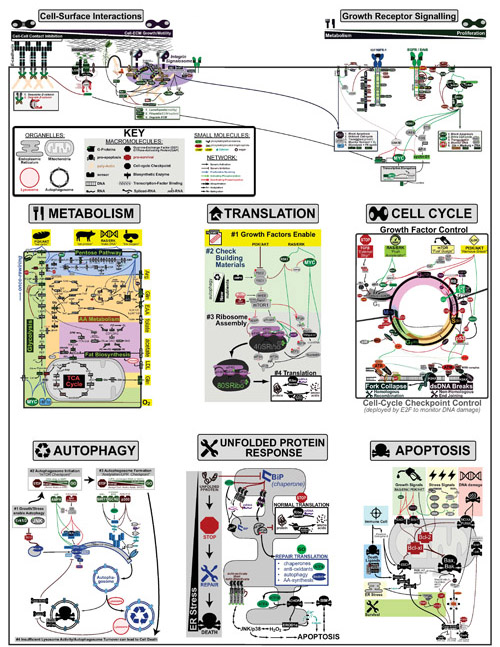
cancer_network_poster-v037-op

Cancer is a complex disease that is defined by at least 10 different “Hallmarks” that reflect mutation or epigenetically-driven reprogramming of normal cellular circuits. Over the past year, I have compiled a document that attempts to combine what’s known about the intra-cellular network that underlie these “Cancer Hallmarks.” This project started out as a single-page infographic but has since expanded into the 2 foot x 3 foot poster pictured above.

My goal was (and is) to create a comprehensive network map that is conceptually accessible to help me (and now others) think about the “big picture” of cancer networks. Of course, this poster is a work in progress and I will continue to update it over time. Below, I give a brief conceptual description of each module I have used to organize this “Canonical” Cancer-Network Map.

Continue reading

Data-Inference vs Predictive-Modeling

Data Inference vs Predictive Models

Quantitative methods in science can be categorized via their typical place within the scientific method as (1) Inferential which is focused primarily on data analysis and (2) Predictive which is focused on formulating mechanistic hypotheses through modeling. In the figure above we summarize some of the most common methods that fall within each of these categories.

Continue reading

Introduction to Bayesian Inference

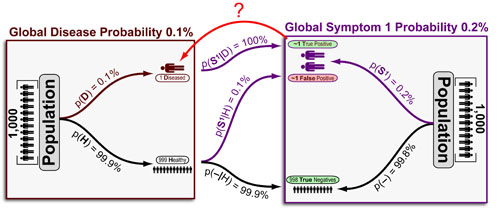
Disease Probability from Symptoms

Baysian statistical inference is a very useful method to “back predict” the probability of a hypotheses from data frequency. In the example above, our “hypothesis” is a disease and our “data” is the an associated symptom.” Now, diseases are not measured directly, but rather, are diagnosed based on a combination of symptoms. Bayesian inference allows us to calculate the “Probability of Disease given Symptom 1 (p(D|S1)) with the following information:
Continue reading

DNA Sequencing Methods

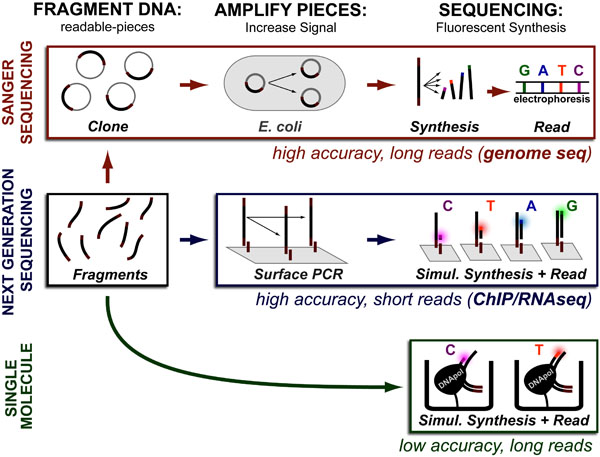
Web

While DNA-sequencing methods are diverse and complex they can be grouped into three categories which share several common features: 1. DNA Fragmentation, 2. Fragment Amplification, 3. Sequencing via Fluorescent-Synthesis. These categories are:
Continue reading

What is Principal Component Analysis??

FIG1-PCA-intuition-v5-op

Principal component analysis (PCA) attempts to find true trends hidden in complex data by filtering out noise and redundancy. It does this by treating complex data as a n-dimensional shape (where n is the number of measurements in your study) and fitting that shape to n 1-dimensional lines called: “principal components” and ranking these lines by the percentage of data variation that they capture.

Continue reading

A “Chemical-Structure Map” of the Metabolome

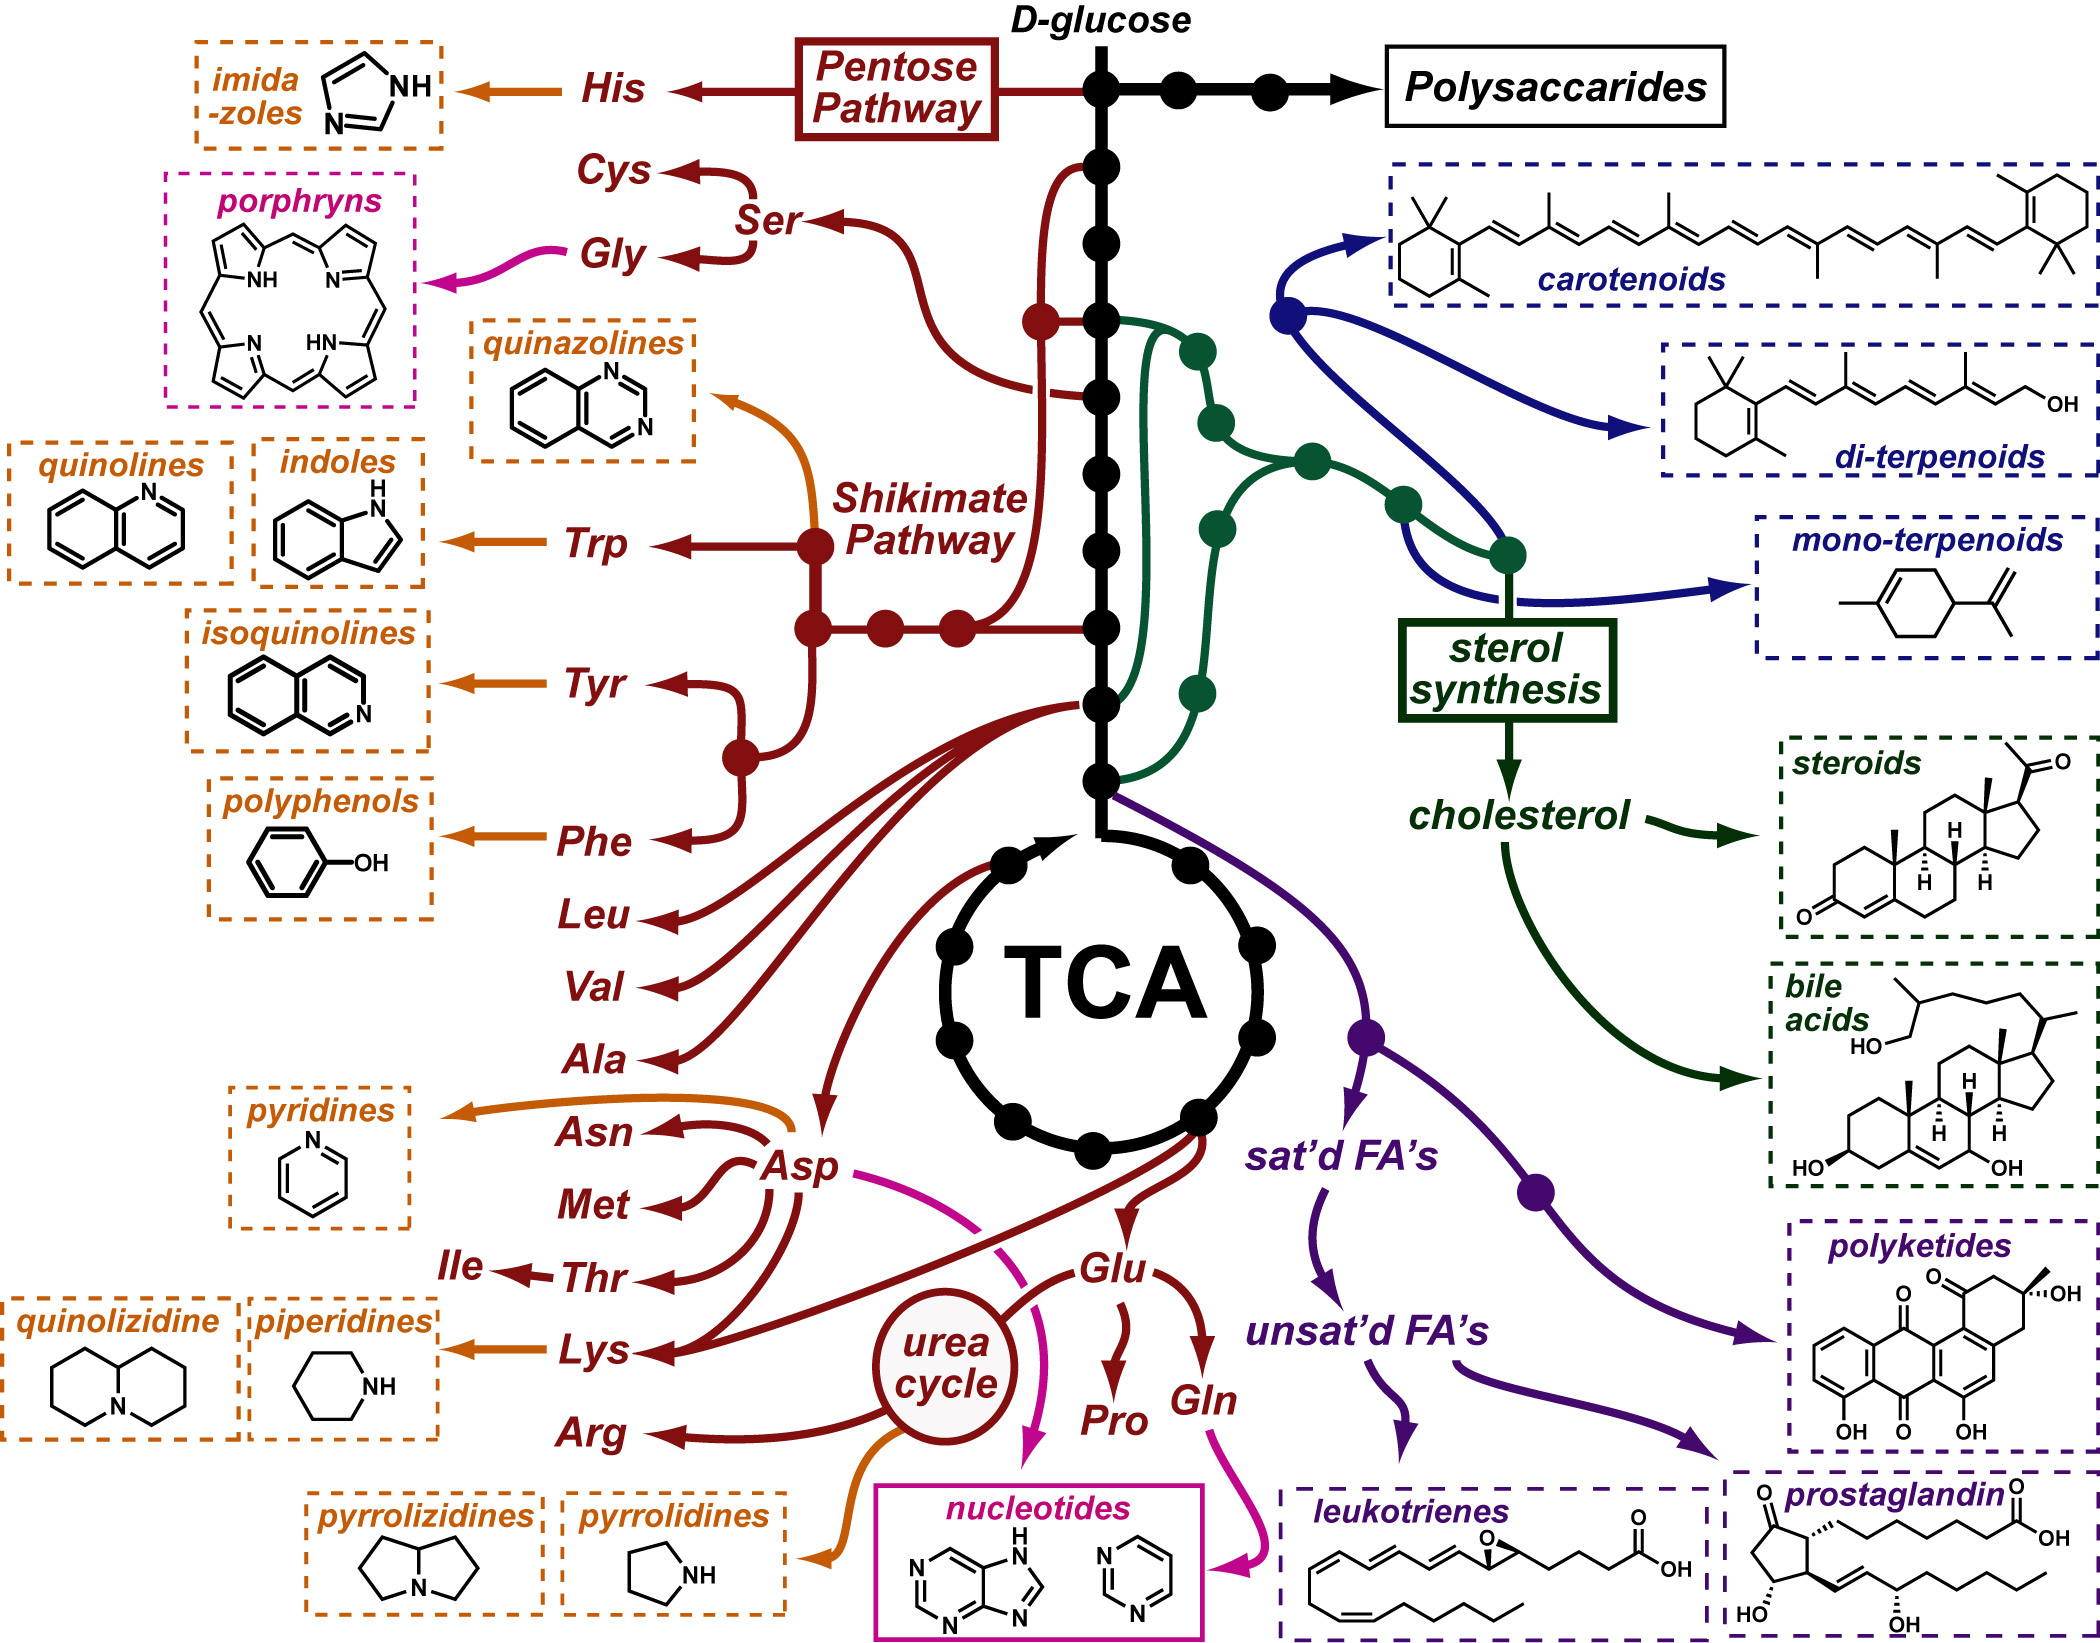
global-metabolism-v7

I’ve always struggled to connect the structures of natural products with the biosynthetic pathways that generate them. I recently found a great resource in the Kyoto Encyclopedia of Genes and Genomes (KEGG) which helped me address this problem directly. The figure above is an adaptation of several of their pathway charts most especially that pictured here.

Continue reading

Estimating Metabolite Concentrations at Steady State

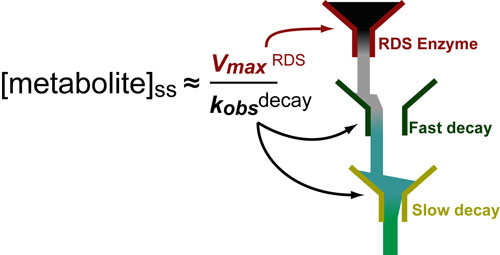
Biosynthetic Pathway-Funnel Analogy

In a follow up to our post on sequential biochemical pathways, we next wanted to present an method to approximate the concentration of a metabolic intermediate in a biosynthetic pathway. In general, under steady state conditions, the steady state concentration of a metabolite can be estimated from the ratio of the Vmax for the upstream rate-determining enzyme over the rate of decay of that metabolite. A more complete equation is detailed below and further discussed in our post on Estimating Protein/Metabolite Levels from RNAseq data.

Continue reading